Attack Analysis
STINGAR User Interface: Attack Analysis Page
The STINGAR user interface includes a page that lists all honeypot events and allows you to select and interrogate each one simply by clicking on the row in the table.
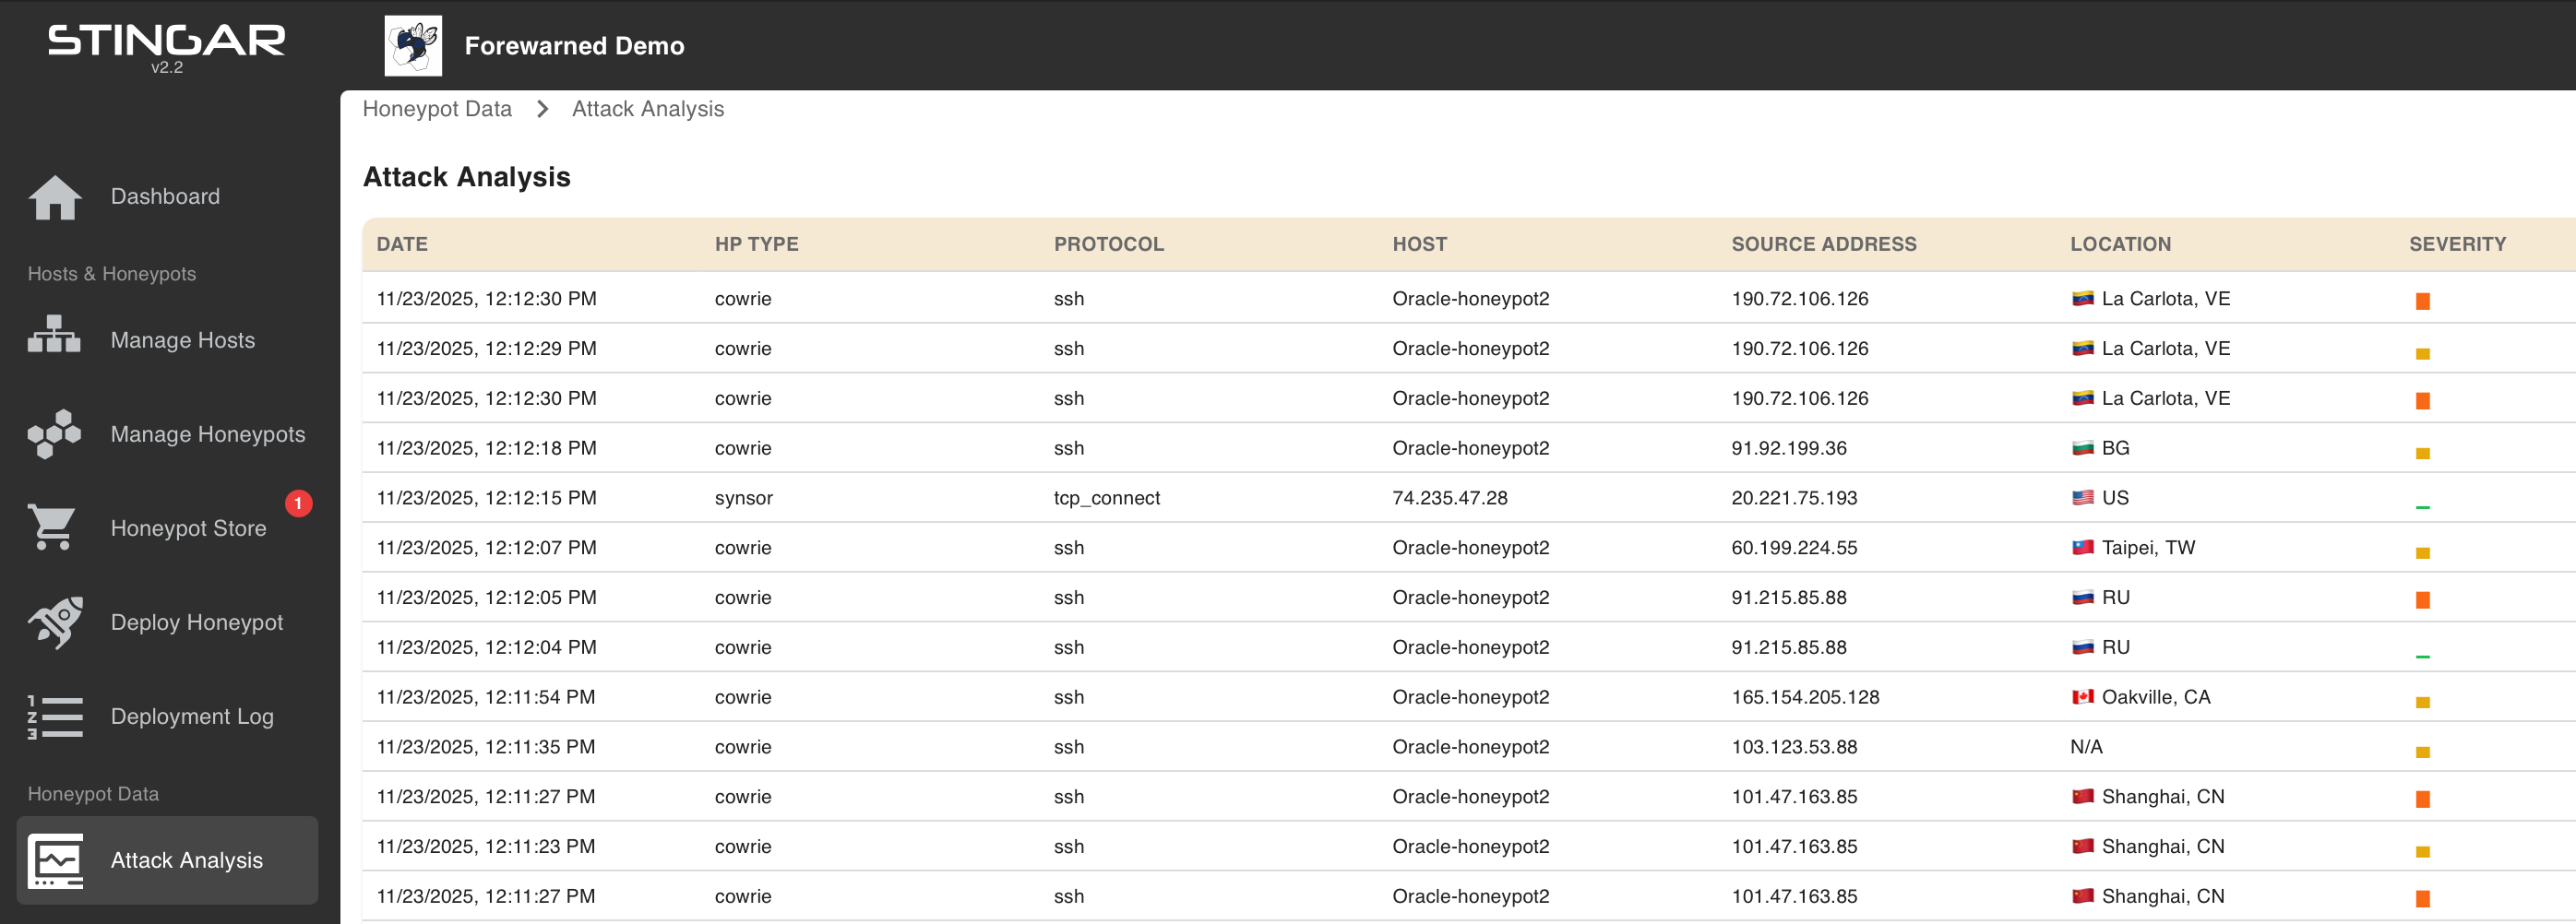
Each attack row details the Date/Time of the attack, Honeypot Type, Protocol, Honeypot host, Source IP Address of attacker, Country/City of attacker's IP Location (if available), and an estimate of Attack Severity* (for some honeypot types).
Sorting Attack Data within the table.
You may filter the list of events by selecting the table title by which you wish to sort.
Attack Severity
Attack Severity column shows a color indicator of the type of attack to allow quick identification of the more severe attack types. Although Honeypots differ in their reporting levels for different protocols and attacker behaviors an estimate is provided of the threat level of each attack. Hover mouse over indicator for more details.
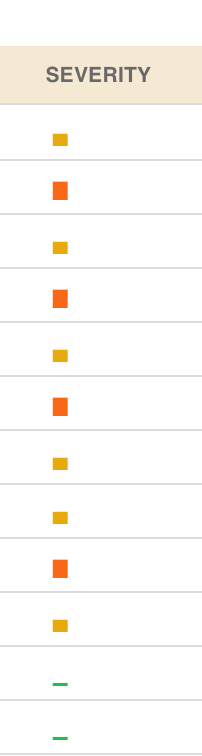
Green - Low (e.g. single port scan) Yellow - Medium (e.g. login credentials attempt) Red - High (e.g. successful login and command execution)
Advanced Search
The Attack Analysis page includes an advanced search panel that is hidden by default. Click the blue Advanced search button in the top-right of the page header to expand the filter panel. The panel slides down from the top and provides:
- Custom date range - Check "Use custom date range" to filter sessions by a specific time window. Choose an anchor date and select either 24 hours or 7 days. Without this option, the table uses the default time window (configurable via SESSIONS_DEFAULT_DATE_RANGE in Settings).
- Filter by IP or CIDR - Enter a source IP address (e.g. 152.32.185.214) or CIDR block (e.g. 152.32.185.0/24) to show only sessions from that source. Supports IPv4 and IPv6; /8, /16, /24, and /32 are valid. The filter validates input and shows an error for invalid formats. Press Enter or blur the field to apply.
Click Hide advanced search to collapse the panel. The Advanced search button is keyboard accessible (Tab to focus, Enter to activate) and includes a visible focus indicator for WCAG compliance.
Other attack analysis options
Honeypot attack information is stored in the Elasticsearch repository on your local STINGAR server. To access the data, you will need to provide the API_KEY that was created for your STINGAR instance when you ran the QuickStart script. This key can be found in the stingar.env file in the STINGAR root directory.
You may access and analyze data in the elasticsearch repository a number of ways:
1. Elasticsearch Direct Access
You may query the elasticsearch repository directly using 'curl' or by entering the query command into a browser. You need to specify your STINGAR server name and provide your API key on the command line. An example elasticsearch query:
2. STINGAR API
STINGAR includes an API which provides a set of queries to retrieve data from elasticsearch in ways that are commonly needed. For example, it allows you to retrieve all attack events on cowrie honey pots between date A & date B; the information is provided in json format. An example of such a query:
Click here For more information about the STINGAR API.
3. Kibana
Kibana is a powerful tool that lets you analyze elasticsearch data and use resulting datasets to generate visualizations. To access STINGAR's implementation of Kibana, use the following URL in any browser:
{your hostname}/kibana